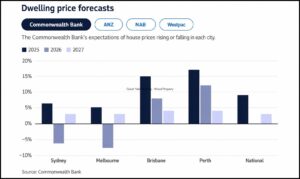

Global Property Market update
If you want an insight to the world’s residential property markets right now, just compare Tokyo’s booming 56% rise in prime prices to Melbourne’s 1.7% slide. In today’s global apartment market, the difference between growth and stagnation isn’t just about interest rates. It’s about the local economy, housing demand, cost of supply, and government policy.
Global market taking a breather
According to Knight Frank’s latest Prime Global Cities Index, the average rate of growth across 46 global cities is slowing. Annual price gains now sit at just 2.5%, well below the decade average of more than 5%. Higher borrowing costs and uncertainty around the timing of rate cuts are keeping momentum muted.
That said, some markets are defying the slowdown. Tokyo, and Seoul top the charts with double-digit growth, powered by strong domestic demand, limited supply, and relatively favourable investment conditions. In Tokyo, the resale market is running hot as buyers are priced out of new builds and are turning to existing stock. A weak Yen (down 3.2% in the last 12 months) and rising overseas interest are also supporting values.
Luxury housing markets in mainland China, on the other hand, are struggling. In Beijing and Shanghai, values have dropped by as much as 1.9% to 1.6% over the past year. These markets are dealing with softer buyer demand, tighter liquidity, and a strategic shift away from real estate as a growth sector..
In Europe, most cities are holding steady. Zurich and Madrid are climbing with gains between 5.4% and 6.1%. London, despite strong rental demand, has seen values fall 3.6% in the past year due to affordability pressures and market caution.
Australia: A tale of six cities
In Australia, the differences between each city is stark. Perth and the Gold Coast are among the strongest performers globally, with annual growth of 4.3% and 3.9% respectively. These results reflect strong interstate migration, affordability relative to Sydney and Melbourne, and low levels of new housing supply.
Sydney is holding its ground. It’s essentially flat over the year, and is supported by deep demand and global appeal. Even though affordability remains a challenge, Sydney’s scale and momentum help it weather softer periods more effectively.
Melbourne has been slower to bounce back. Values declined 1.7% over the past year. Although the fundamentals remain sound, including steady population growth and a well developed apartment market, weaker buyer sentiment and delayed supply are weighing on performance.
Rents are rebounding
Rental markets tell a different story. Across the 16 cities tracked in Knight Frank’s Prime Global Rental Index, rental growth has climbed to 3.4% in the past year. Tokyo leads with a 9.6% rise, followed by New York at 7.8% and Sydney at 5.%.
These increases reflect more than just a rebound from the pandemic. Tight supply and strong demand are creating upward pressure, particularly in cities where development activity has not kept pace with population or employment growth. Zurich and Frankfurt are clear examples of this, where limited availability is continuing to drive rent increases despite broader economic challenges.
Melbourne’s rental market is gradually tightening. Rents rose 2.6% year-on-year, a sign that demand is picking up. While not as steep as Sydney’s growth, it reflects improving sentiment and a return to urban living. However, challenges remain, particularly around getting new rental stock into the market quickly enough to meet demand.
What’s driving the market now?
While interest rates are still influencing activity, housing supply is the big story globally. The cities that are seeing the highest rise in either values or rents, are typically those where demand is outpacing supply. No surprise there.
Construction activity has slowed in many markets, in part due to high costs and more challenging access to finance. This slowdown means new housing stock is not being delivered fast enough. The gap between supply and demand is only set to widen unless conditions improve for developers.
Policy settings also play a role. In cities where regulation or taxes have made property investment less attractive, supply has slowed and markets have softened. Melbourne is in this camp. This is not the leading factor in most cases, but it can make the difference between a market gaining momentum or falling behind.
Sentiment is also a factor and self perpetuates fundamentals. In Tokyo, confidence is high and foreign interest is strong. Buyers are competing for limited stock and prices are rising. In Melbourne, hesitation is more common among both buyers and builders, which is keeping growth subdued for now.
Looking ahead
Global apartment markets are no longer moving in sync. Some cities are racing ahead, while others are in a holding pattern. What makes the difference is a mix of demand strength, housing supply, local economics and government policy.
Melbourne has strong fundamentals. It is liveable, diverse, and well positioned to grow. But for the market to turn around, the city needs more new housing, greater investor confidence, and a stable outlook for buyers and renters. Governments at the moment are retarding investment and development via competing with the private construction sector and charging higher property taxes.
2026 could bring a broader recovery if interest rates ease and supply begins to catch up. Cities that are prepared for this shift (by supporting development and unlocking stock) will be the ones that attract new development.
Knight Frank Prime Global Rental Index
Changes to 2025 Q3
| Rank/Location | 12-month % change | 6-month % change | 3-month % change |
| 1 JP Tokyo | 9.6 | 3.4 | -0.3 |
| 2 US New York | 7.8 | 4.4 | -2.1 |
| 3 CH Zurich | 6.2 | 3.6 | 0.9 |
| 4 HK Hong Kong | 6.0 | 0.7 | -1.2 |
| 5 AU Sydney | 5.7 | 3.8 | 3.0 |
| 6 DE Frankfurt | 4.7 | 1.6 | 0.2 |
| 7 US Los Angeles | 3.9 | -1.1 | -0.2 |
| 8 CH Geneva | 3.7 | 2.0 | 0.6 |
| 9 DE Berlin | 3.3 | 0.6 | -0.4 |
| 10 SG Singapore | 2.7 | 1.4 | -0.5 |
| 11 AU Melbourne | 2.6 | 2.0 | -0.1 |
| 12 MC Monaco | 2.0 | 0.0 | 0.0 |
| 13 UK London | 1.8 | 1.7 | 0.6 |
| 14 US Miami | 1.0 | 0.1 | -0.3 |
| 15 NZ Auckland | -2.3 | -2.5 | -1.5 |
| 16 CA Toronto | -3.6 | 2.1 | 1.1 |
Knight Frank Prime Global Cities Values Index Q3 2025
Ranked by annual % change
| Rank/Location | 12-month % change | 3-month % change |
| 1 JP Tokyo | 55.9 | 30.2 |
| 2 KR Seoul | 25.2 | 2.3 |
| 3 IN Bengaluru | 9.2 | 0.3 |
| 4 AE Dubai | 8.5 | -6.9 |
| 5 IN Mumbai | 8.3 | 1.5 |
| 6 SG Singapore | 7.9 | 2.4 |
| 7 ES Madrid | 6.1 | 0.8 |
| 8 CH Zurich | 5.4 | 1.8 |
| 9 PH Manila | 5.4 | 1.1 |
| 10 KE Nairobi | 5.3 | 0.0 |
| 11 AU Perth | 4.3 | 1.9 |
| 12 IN Delhi | 4.2 | 0.4 |
| 13 CH Geneva | 4.2 | 1.2 |
| 14 TH Bangkok | 4.0 | -0.4 |
| 15 AU Gold Coast | 3.9 | 0.3 |
| 16 MC Monaco | 3.6 | 2.5 |
| 17 AU Brisbane | 3.4 | 0.6 |
| 18 PT Lisbon | 3.1 | 0.6 |
| 19 DE Frankfurt | 3.1 | 0.1 |
| 20 DE Berlin | 2.7 | 0.3 |
| 21 IE Dublin | 2.3 | 0.0 |
| 22 SE Stockholm | 1.8 | 0.0 |
| 23 NZ Christchurch | 1.8 | 3.2 |
| 24 FR Paris | 1.4 | 0.6 |
| 25 NZ Wellington | 1.2 | 1.9 |
| 26 MY Kuala Lumpur | 0.9 | 0.6 |
| 27 ID Jakarta | 0.8 | 0.0 |
| 28 RO Bucharest | 0.2 | 0.2 |
| 29 US New York | -0.1 | 0.5 |
| 30 AU Sydney | -0.1 | 1.2 |
| 31 US Miami | -0.2 | 0.8 |
| 32 US Los Angeles | -0.3 | -1.4 |
| 33 AT Vienna | -0.5 | -0.2 |
| 34 KH Phnom Penh | -0.8 | -1.0 |
| 35 US San Francisco | -0.9 | -0.0 |
| 36 IT Milan | -1.3 | 0.0 |
| 37 CN Shanghai | -1.6 | -2.3 |
| 38 AU Melbourne | -1.7 | -0.9 |
| 39 CN Beijing | -1.9 | -2.7 |
| 40 TW Taipei | -2.6 | -1.8 |
| 41 UK London | -3.6 | -1.5 |
| 42 HK Hong Kong | -3.7 | 0.1 |
| 43 NZ Auckland | -3.9 | -5.6 |
| 44 CA Vancouver | -6.5 | -4.5 |
| 45 CN Shenzhen | -6.8 | -4.1 |
| 46 CA Toronto | -6.9 | -3.3 |